Why does DAZ Studio still not have any official tools that show VRAM usage of the current scene?
 linvanchene
Posts: 1,382
linvanchene
Posts: 1,382
Since Iray has been introduced in 2015 the same issues and challenges remain unadressed for GPU rendering with DAZ Studio:
DAZ Studio does not offer any official tools that show accurate VRAM information of the current scene.
As a consequence users do not have any clear way to tell when exactly Iray switches from GPU mode to CPU mode when scenes do not fit the VRAM.
In 2017 VRAM is still a scarce resource. Users have to carefully choose texture sizes and subidvision levels of geometry.
Currently DAZ Studio users are forced to make such changes blindly in a trial and error way without knowing for sure if the scene will fit VRAM or not.
- - -
Based on some other posts a main challenge of monitoring VRAM is that information can only be gathered when the live rendering preview viewport is in use.
It seems some artists and developers creating plugins and addons for DAZ Studio either are struggling with this limitation or do not feel like customers are interested in accurate VRAM information.
Nevertheless, on a regular basis there are threads on the forum of customers who are confused
- if Iray is running in CPU or GPU mode
- how to know exactly how much space each texture and scene object takes in VRAM.
- - -
Since 2013 the OctaneRender plugin for DAZ Studio featured both basic and even advanced tools to monitor the scene size in VRAM and even adjust the texture size.
VRAM Summary of the scene
- size of textures
- size of geometry
- space reserved for the rendered images (frame buffer)
- space used by the software itself (engine runtime data, nodesystem data)

- - -
Tools to reduce texture size with VRAM information included
How VRAM information is gathered in other 3rd party plugins
As long as the live render engine viewport is not active there is no VRAM information available. Nevertheless the moment the live viewport is activated all the VRAM information based on the current scene remains available until the moment the user makes any changes to the scene.
I hoped that sooner or later someone at DAZ3D would be able to make a similar workflow possible with Nvidia Iray:
-> When the Iray live preview window is in use then all the information about VRAM use should in theory be accessible.
- step 1) user activates the Iray live preview windows so VRAM information of the current scene is gathered
- step 2) VRAM information for the current scene is displayed in DAZ Studio, plugins and addons
- step 3) user makes changes to texture size and geometry in addons based on the information gathered
- step 4) automatically or manually refresh the Iray live preview viewport and update VRAM scene information
- repeat as necessary until scene fits into VRAM
- - -
@ Are there allready tools available?
- It is true that those who have access to OctaneRender for DAZ Studio plugin can also use it to gather an estimate if the scene will fit into VRAM in Iray as well.
Nevertheless, especially with the large scenes who use the full amount of VRAM it takes a considerable amount of time of reloading scenes when switching render engines.
It is not a smart workflow to switch back between Iray and other 3rd party render engines if the current project should be rendered in Iray in a quick and efficient way.
Furthermore, it cannot be expected of DAZ Studio users to pay large amounts of money for 3rd party render engines just to get access to accurate VRAM information.
- From time to time you can find addons like "Memory Assistants" or "Scene Optimizers" in the DAZ store. But unfortunately they also do not actually gather the accurate VRAM scene information but provide mere estimates on the object level based on calculations.
- Other users seem to rely on 3rd party tools like GPU-Z and CPUID which also provide mere general estimates and were not designed with the intent of providing detailed information about VRAM usage separated into cateogories geometry, textures and software.
- - -
Request and open questions:
Accurate statistics of a scene size in VRAM should be a basic feature of any 3d software that features GPU rendering.
1) Why does DAZ Studio still not have any official tools that show detailed VRAM usage of the current scene?
2) Are there any plans to include such tools in the next DAZ Studio version?
- - -
Submitted as Request #242785
This thread provides some additional information about how VRAM scene information works in 3rd party plugins that was not included in the submitted request.

Daz 3D is part of 
Connect
DAZ Productions, Inc.
7533 S Center View Ct #4664
West Jordan, UT 84084
Licensing Agreement | Terms of Service | Privacy Policy | EULA
© 2025 Daz Productions Inc. All Rights Reserved.
Comments
Does Iray provide a detailed break-down of memory use via the APIs? if not Daz Studio won't be able to read from there. Tools like GPU-Z run in elevated mode, DS doesn't (and shouldn't) so it seems likely it could not obtain the usage information from the GPU itself (which would not, in any event, be broken down by items as I think you wish). Octane is able to provide the information because that is how it is written, not because it is automatcially possible to do so.
How does Iray know that a scene will not fit into VRAM?
How does Iray know that it now must switch from GPU to CPU mode?
-> Iray must have some kind of way to read how much space the current scene will take in VRAM when the render progress is triggered in either the preview viewport or the main render window..
-> This also means Iray must know the exact numbers of current scene size and remaining VRAM space.
Why is that information gathered not displayed in DAZ Studio the very moment the user activates either the Iray live preview viewport or the separate final render window?
I could live with the fact that there is not a detailed breakdown of VRAM use for each indivdual texture and geometry in the scene.
Please lets not get hung up on that challenge and adress the main issue first
-> Nowhere in DAZ Studio is a summary of VRAM usage in the form of:
- VRAM used by all textures
- VRAM used by all geometry
- VRAM used by the render engine itself (kernel, frame buffer etc)
-> Having at least an indication of those three categories would allow users at least some basic form of tracking how DAZ Studio Iray is using the VRAM.
- - -
If even that is asking to much then it should at least be possible to display a single number in the form of
- VRAM remaining
- - -
- - -
You can see some info in the renderer log window:
Iray VERBOSE - module:category(IRAY:RENDER): 1.2 IRAY rend progr: CUDA device 1 (GeForce GTX 780): Processing scene...
Iray VERBOSE - module:category(IRAY:RENDER): 1.4 IRAY rend stat : Geometry memory consumption: 31.2183 MiB (device 0), 0 B (host)
Iray VERBOSE - module:category(IRAY:RENDER): 1.5 IRAY rend stat : Geometry memory consumption: 31.2183 MiB (device 1), 0 B (host)
Iray VERBOSE - module:category(IRAY:RENDER): 1.5 IRAY rend stat : Texture memory consumption: 204.356 MiB (device 1)
Iray VERBOSE - module:category(IRAY:RENDER): 1.4 IRAY rend stat : Texture memory consumption: 204.356 MiB (device 0)
Iray VERBOSE - module:category(IRAY:RENDER): 1.5 IRAY rend stat : Lights memory consumption: 196 B (device 1)
Iray VERBOSE - module:category(IRAY:RENDER): 1.4 IRAY rend stat : Lights memory consumption: 196 B (device 0)
Iray VERBOSE - module:category(IRAY:RENDER): 1.5 IRAY rend stat : Material measurement memory consumption: 0 B (GPU)
Iray VERBOSE - module:category(IRAY:RENDER): 1.4 IRAY rend stat : Materials memory consumption: 101.152 KiB (GPU)
Iray Iteration: 1
So, this info from Iray IS available and there is no excuse to not display it somewhere :)
Update / Edit: 2017 08 30:
- Some information about VRAM can also be found in the DAZ Studio log file.
compare this thread:
https://www.daz3d.com/forums/discussion/172866/quick-guide-finding-information-about-vram-directly-in-daz-studio
- In addition there is VRAM information scrolling by in the info bar in the bottom left corner.
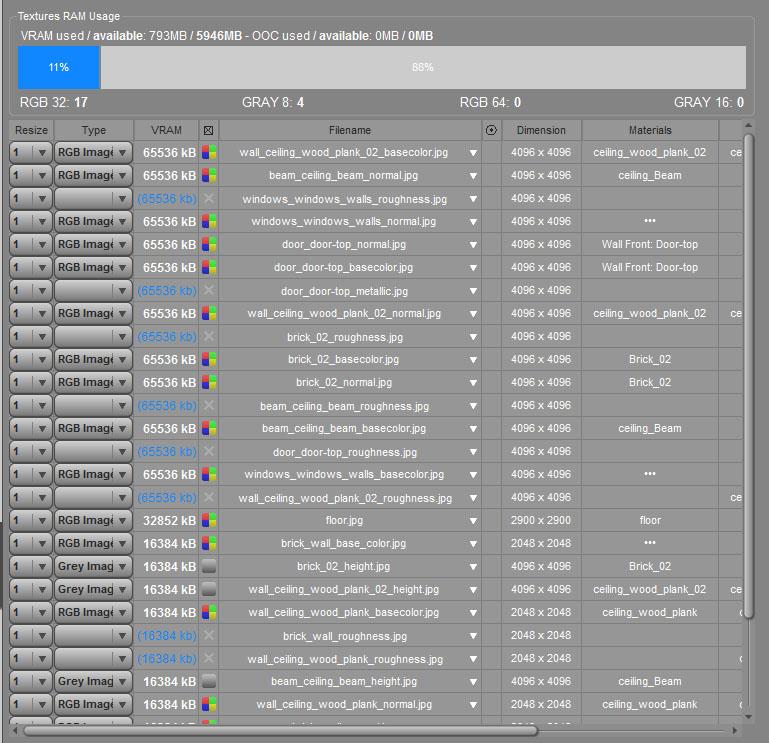
The render log window does display the information but not in an easily accessible and user friendly form of a summary in a separate tab dedicated to only that task like shown in this screenshot:
- The render log window is only displayed if you are using the separate render window.that is mostly used for the "final" render.
- The render log also scrolls automatically and you manually need to pause it to study the information.
- When the render is "finished" that render log display window closes immediately.
- - -
-> When I am setting up scenes I would like to use the Iray live viewport to make changes to the scene in real time and immediately see the resulting VRAM changes.
Is there any way to display all this information when the Iray live viewport is active as well?
Why not display that information in a separate DAZ Studio tab?
It would be helpful if that gathered information
- would be displayed the moment the live preview viewport is activated
- updated automatically whenever the user makes any changes to the scene as long as the live viewport is active
- would be displayed with some colored visual aids to get a quick understanding of scene composition (similar as shown in the screenshot)
- - -
Those users who are not interested in actual data could simply ignore that tab.
Those users interested in actual VRAM data about their scene could add it to their activity layout where needed
Those are logs you get while you render. That doesn't mean info is available on demand from Iray.
You need to remember that, as far as I know, Iray (and 3Delight, and OptiTex) is a black-box to Daz - they can't make changes to the engine, they just have an API/SDK which lets them send data and instructions to, and receive output from, Iray. We don't know whether the information you want is available in a timely manner, or at all in some cases.
That is pretty much similar to what 3rd party plugin developers keep telling me. They would be willing to go to great lenghts to add more features to their plugins but they cannot as long as the DAZ Studio Iray or the DAZ Studio API does not provide the proper "outputs" to provide the necessary data.
Normally you can send a "call" to the "blackbox" and then the necessary "answers" will be provided to display the required data or perform the intended action.
- - -
And that is why I submitted a ticket / request with the hope they can provide an answer.
If the needed functionality is not provided by the current Iray SDK or API then it would be great if DAZ3D staff would provide some feedback to Iray developers so they can make the necessary changes.
- - -
Those logs are injected into DS via Iray's ILogger interface any time when something in scene changes (like texture image). It doesn't matter if renderer is in interactive or final mode. So clever logger implementation might cherry-pick them and display somewhere in convenient manner. Lower right corner of viewport will suffice.
Oh, did I say 'clever implementation' ?..
Reading the Iray API docs (http://www.migenius.com/doc/realityserver/latest/resources/general/iray/index.html) I've found that IRender_context has very generic method for setting/getting options. You need to pass the name of option to get_option method to query something. Sorrily there is no definitive list of all supported option names, so I cannot say for sure that option for querying texture space utilization exists but it would only be logical.
I'm pretty sure the SDK has access to the material and shader objects, scripting certainly does. Though this is a bit OT for your thread.
Thanks to the VERBOSE mode that's in the public beta, you can more easily see the sequence of events and more importantly, their timing. You can see, for example, that during construction of the scene database, the geometry is created fairly quickly, whereas the textures take much longer. I'm guessing this is due to the on-the-fly compression. One thing is fairly clear, in that at the start of the render, Iray doesn't know if there will be a failure. It seems to rely on thrown errors that occur extemporaneously... or at least this appears to be how D|S has integrated into it. If Iray reports the error condition, it would be after the fact, but it could conceivably be parsed and reworded into a more clever interface that is more user friendly. Users wouldn't have to come here with their troubleshooting logs.
If the D|S interface/API into the Iray rendering engine were published, a third-party could develop such a tool, but there may be restrictions placed on disseminating such information outside of an NDA with nVidia. Daz seems to prefer add-ons like these come from vendors, who add value to the base program which is given away for free.
There is a much simpler way to do this: DzApp already has signals for debug and warning log messages, the only thing to add is the signal for regular log messages. This way any 3rd party plugin or even script could connect to it and start analyse logs to it's liking.
IRay rendering process is really a black box, basically you feed the scene description into it and then call render() and wait what happen :) IRay uses logger and progress callbacks to provide host app with some info about process plus you may query some options async while it is busy rendering. They had chosen this design to transparently support networked rendering I assume.
Only if said call and answer have been planned in the API.
edited: rephrase this post and replaced a 2nd "anyone" with "other customers" and added "interested in accurate data" to give the below sentence the intended meaning.
I am aware that most of my posts are "too long to read". But the whole post pretty much said: If it was not planned to gather VRAM information then please ask Iray developers to make those "calls" available.
- - -
Let's try this the other way around:
I) Can anyone give me a reason why it would be bad for other customers if DAZ Studio users interested in accurate data would know exactly how much VRAM they have left when they are creating scenes?
- - -
Edited:
I do not understand why people are trying to argue with me on this. Why do you feel like this would be negative for you and you would be in a worse position then now when I would be able to to my job with accurate data about how the VRAM is used?
As has been mentioned above, even if Iray did/does give the information it is still not while ctreating the sceen but only when the data is sent to the GPU - at which point, if memory is exceeded, a restart is required.
Update/Edit: added more information about how a "refresh" and a "restart" works in other render engines to be sure we are talking about the same thing.
I am not sure I understand what you mean with "restart". Is the "restart" the "delay" that happens in the Iray live viewport when a new object is added and the loading bar appears? I struggle with the word "restart" because at least in OctaneRender not the whole scene is reloaded but only new objects are added to the VRAM. At least in OctaneRender it is more of a "refresh". A restart only happens if the user "forces" the whole scene to reload by clicking the corresponding button.
Is Iray reloading the whole scene into VRAM each time even if only one new object is added?
Example - Could it work like this in Iray?
- The customer activates the Iray live preview mode.
- the customer adds an object to the scene.
- At this very moment Iray automatically refreshes the scene and checks if the scene still fits into VRAM.
Now either one of two things happen:
A) The scene fits into VRAM and GPU mode is activated
B) The scene does not fit inot VRAM and CPU mode is activated
In both cases either A or B it should be theoretically possible to display the information
IRAY rend stat : Geometry memory consumption
IRAY rend stat : Texture memory consumption:
in a separate tab that displays those numbers until the next time the Iray live viewport is refreshed.
- - -
Rephrased the last post.
Can I kindly ask everyone to look at the big picture:
-> Would it be an improvement of the current situation if DAZ Studio users would know exactly how much VRAM they have left to build their scenes?
Yes, or no?
Otoy managed to provide this information in the very first builds of their render engine because they understood that a basic requirement of working with GPU render engines is the ability to know how much VRAM you have left..
Nvidia Iray developers certainly have a similar skill level.
It should be a matter of hours but certainly not longer than a few days to implement the changes to the Iray API so the needed "calls" or "outputs" can be accessed not only in DAZ Studio but in any other 3d software that supports Iray.
In general, once the GPU has run out of memory it is necessary to at least close and reopen DS, and soemtimes to restart the operating system, before Iray can again use the GPU. So by the time yu had a report that the GPU was overloaded it would be locked until DS was restarted.
Updated / edited: Rephrased to stress that one of the most important things to understand when creating scenes for GPU rendering is usually to add one scene object after the other in order not to exceed the available VRAM.
Update / edited 03/05/17: deleted unneeded parts. rephrased some sentences for better understanding
Thank you. Now I understand what you mean.
-> One goal of VRAM Management is to prevent that DAZ Studio reaches a state of being locked up or needing a restart.
To reach that goal at least a summary of VRAM used by all textures and all geometry is crucial to use the same workflow allready proven when working with other GPU render engines:
When creating scenes for GPU rendering it is recommended to add one scene object after the other carefully observing the remaining VRAM.
If the remaining VRAM starts to become critical the user then can reduce texture sizes on the allready existing scene objects.
Then the user can deceide if the next object will fit into VRAM or if more steps to reduce the size of existing scene objects are needed.
In any case the whole point of any "VRAM management" features are to create scenes in a time efficient way without triggering any critical states of the engine or the software.
The worst possible scenario is that you have to restart DAZ Studio. Especially with large scenes a lot of time reloading the whole scene is wasted.
Therefore it is important to know BEFORE you add the next object or texture how much VRAM is still available.
-> And that is why it is important that each time a new object is added to the scene while the live viewport is active the VRAM information is updated as well and displayed.
- - -
Edit / Update: Thank you for helping to provide valuable insight about the areas in which Iray and OctaneRender seem to be different. I will update the submitted ticket / request with a summary to make it more understandable which workflows are possible if information about VRAM usage is available.
There are some goodpoints raised here, but also a few ares of concern - at least to me!
Liek most here I have no clue what information can be obtained from a graphics card. However, it woudl be good if it woudl be possible to see current VRAM utilisation - if possible broken down into 'non Daz Studio' and what DS is using. maybe broken down into type: such as for geometry, texture maps, etc. Having VRAM be 'loaded'' as and when things are added to the scene is a big (BIG!!!!) no-no for me. A flush VRAM option woudl be good tohave, but that would, obviously, have to be limited to only any VRAM allocated via Daz Studio/Iray If that flush VRAM coudl be added a further option of 'test VRAM load' might be useful to have, whereby a 'dummy' render is kicked off to see what VRAM usage the current scene would have.
I've not run into this recently; could this be a difference in the device driver and OS (I'm on Windows 7 pro). Cas in point, the sci-fi square blows memory on both my gpus; if I clear the scene and do something else both cards get used without closing Studio.
It seems to vary - some people have reported needing to restart the operating system. It may perhaps be improved with the newer versions of Iray and/or newer drivers, too.
I think an important point needs to be made in that, for nVidia, the hobby market isn't even on their radar. Their business is in catering to commercial and industrial users who are encouraged to use much more robust "server farm" appliances, where a card with less than 8G or 12G is not even considered. These users also don't tend to render with mutiple huge textures. It's more common for architects and designers to use procedural surfaces, perhaps with some fairly simple tiled resources such as brick or asphault. Rendering of humans requires a lot more RAM.
A developer working with the Iray SDK probably has access to internal callbacks of the engine, so I'm sure this level of feedback is possible somewhere in the chain. Whether it's exposed in the DLLs Daz uses to access Iray I'm not sure. Daz tends to rely on third-party vendors to provide enhancement plug-ins, so I think if anything, this is where the effort will come from. Someone mentioned piping the ILogger interface to a user screen, and if this is possible, it's certainly one way such a tool could be created. The logging info is there, but cryptic. A tool that parses, filters, and sanitizes this information would be very useful indeed.
I don't think we're trying to be argumentative, or at least I'm not. But considering nVidia's business interests and our very tiny corner of an Iray user base, I think we just have to be realistic about the kind of tools that are available.
OS restart was needed for one older (more than year ago) driver revision, with the latest drivers only DS restart is needed in some cases.
Don't underestimate our corner :) iRay is new player and professional scene is very conservative. AFAIK thare is still no feature movie that used iRay. Even it's big brother mental ray is not that popular (especially after Softimage death). Nvidia wants to spread it as wide as possible, that's why it gives access to SDK for free to anybody who develop integrations. That said, DS userbase might well be the largest one :)
Nvidia targets the cloud rendering with iRay, consider using your local GPU(s) as "temporary workaround" :) In the cloud solution there will be no 'insufficient texture memory' issue, there will be 'you have insufficient funds to render your image with that much textures' issue :)
Most of the feature films have dedicated developers and don't rely on the toolset provider. nVidia isn't going to invest the money unless a broad spectrum of their users want the feature, and commercial users tend to keep the technology they develop in-house. Iray is touted as a "push button" renderer, which isn't ideal for the kind of creative development, and most studios want complete control over the look. I think there actually might be some "sneak" features that have used Iray for at least portions, considering 3DS Max has Iray as an option.