Nvidia Iray live preview viewport drops to CPU mode - #248297
 linvanchene
Posts: 1,382
linvanchene
Posts: 1,382
Submitted as Request #248297 linked back to this thread.
- - -
There have been several threads in the past in which customers mention that they are experiencing issues with Iray droping from GPU to CPU mode.
In theory Iray should only drop to CPU mode when the VRAM of the video card is fully used.
In practice it seems this is happening at seemingly random occasions with plenty of VRAM to spare.
- - -
Known workarounds for final rendering:
If you are done preparing your scene and are ready to render an image in the final render window it is highly recommended
- to save the scene and close DAZ Studio
- restart DAZ Studio, reload the scene and start the final render
- - -
Drawback of Nvidia Iray live preview viewport dropping to CPU mode
What is the point of the Nvidia Iray live preview viewport?
A GPU live viewport is supposed to give an almost realtime impression at the same or a similar quality as the final render.
In theory:
Users are supposed to be able
- to preview different texture sets
- swap in and out different characters
- try different clothing, hair or props
etc.
In practice
After swapping in and out a few characters, textures and hair props the Iray Live Preview Viewport drops to CPU mode.
A look at both the DAZ Studio Log file and GPU - Z shows that only a fraction of the available VRAM was being used.
There does not seem to be any valid reason for the Nvidia Iray live preview viewport to be falling back to CPU mode as long as there is still plenty of VRAM available.
- - -
How can you know that the Iray live preview has fallen back to CPU mode?
1) You can check the DAZ Studio log file:
Help -> Troubleshooting -> View Log File...
for more information please compare:
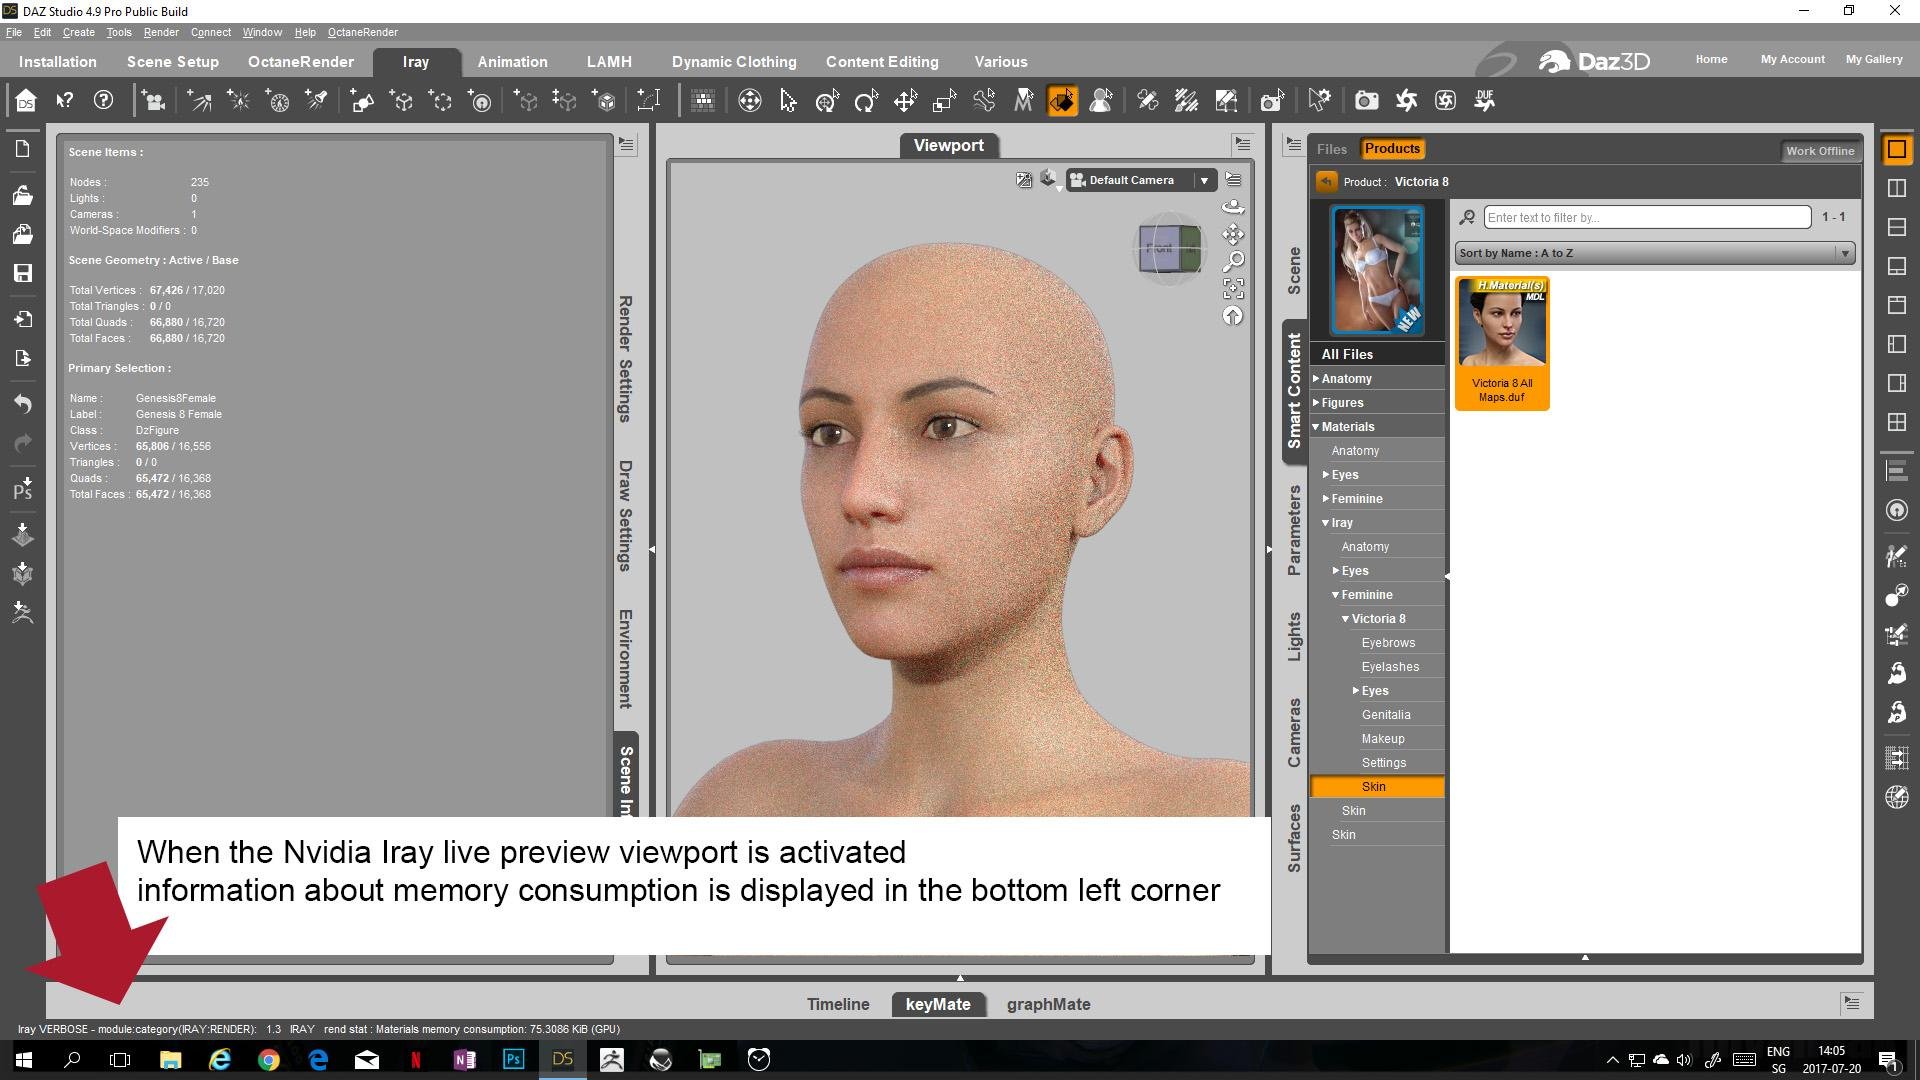
2) Closely observe the info bar in the bottom left corner after you load a new object or texture with the Nvidia Iray live preview viewport active.
- - -
TEST EXAMPLE 01):
Update/Edit 2017 - 07 - 22:
System information:
DAZ Studio 4.9.4.122
Nvidia Game Ready Driver 384.76
Windows 10 Pro
OS Build 15063.483
1x GTX 1080 for the display
2x GTX 1080 Ti to render
based on the DAZ Studio log file:
The total VRAM is: 11 GiB
The available VRAM on Windows 10 is: 9.17244 GiB
-> This means with all other applications closed and only DAZ Studio running the Nvidia Iray live preview viewport should not fall back into CPU mode unless the whole 9 GB of VRAM are used up by geometry, textures, the frame buffer and the work space.
- - -
TEST STEPS:
Step 1) started DAZ Studio
Step 2) loaded Genesis 8 female
2017-07-20 14:03:04.769 Iray VERBOSE - module:category(IRAY:RENDER): 1.9 IRAY rend progr: CUDA device 0 (GeForce GTX 1080 Ti): Processing scene...
2017-07-20 14:03:04.769 Iray VERBOSE - module:category(IRAY:RENDER): 1.8 IRAY rend progr: CUDA device 2 (GeForce GTX 1080 Ti): Processing scene...
2017-07-20 14:03:04.770 Iray VERBOSE - module:category(IRAY:RENDER): 1.2 IRAY rend stat : Geometry memory consumption: 3.70369 MiB (device 0), 0 B (host)
2017-07-20 14:03:04.770 Iray VERBOSE - module:category(IRAY:RENDER): 1.11 IRAY rend stat : Geometry memory consumption: 3.70369 MiB (device 2), 0 B (host)
2017-07-20 14:03:18.045 Iray VERBOSE - module:category(IRAY:RENDER): 1.2 IRAY rend stat : Texture memory consumption: 549.001 MiB (device 0)
2017-07-20 14:03:18.046 Iray INFO - module:category(IRAY:RENDER): 1.2 IRAY rend info : Initializing light hierarchy.
2017-07-20 14:03:18.047 Iray VERBOSE - module:category(IRAY:RENDER): 1.11 IRAY rend stat : Texture memory consumption: 549.001 MiB (device 2)
2017-07-20 14:03:18.047 Iray INFO - module:category(IRAY:RENDER): 1.2 IRAY rend info : Light hierarchy initialization took 0.00s
2017-07-20 14:03:18.047 Iray VERBOSE - module:category(IRAY:RENDER): 1.11 IRAY rend stat : Lights memory consumption: 948 B (device 2)
2017-07-20 14:03:18.048 Iray VERBOSE - module:category(IRAY:RENDER): 1.2 IRAY rend stat : Lights memory consumption: 948 B (device 0)
2017-07-20 14:03:18.137 Iray VERBOSE - module:category(IRAY:RENDER): 1.11 IRAY rend stat : Material measurement memory consumption: 0 B (GPU)
2017-07-20 14:03:18.138 Iray VERBOSE - module:category(IRAY:RENDER): 1.11 IRAY rend stat : Materials memory consumption: 75.3086 KiB (GPU)
2017-07-20 14:03:18.312 Iray INFO - module:category(IRAY:RENDER): 1.9 IRAY rend info : CUDA device 0 (GeForce GTX 1080 Ti): Scene processed in 13.773s
2017-07-20 14:03:18.314 Iray INFO - module:category(IRAY:RENDER): 1.2 IRAY rend info : CUDA device 0 (GeForce GTX 1080 Ti): Allocated 4.37901 MiB for frame buffer
2017-07-20 14:03:18.318 Iray INFO - module:category(IRAY:RENDER): 1.8 IRAY rend info : CUDA device 2 (GeForce GTX 1080 Ti): Scene processed in 13.779s
2017-07-20 14:03:18.367 Iray INFO - module:category(IRAY:RENDER): 1.2 IRAY rend info : CUDA device 2 (GeForce GTX 1080 Ti): Allocated 4.37899 MiB for frame buffer
2017-07-20 14:03:18.369 Iray INFO - module:category(IRAY:RENDER): 1.9 IRAY rend info : CUDA device 0 (GeForce GTX 1080 Ti): Allocated 1.65625 GiB of work space (2048k active samples in 0.055s)
2017-07-20 14:03:18.529 Iray INFO - module:category(IRAY:RENDER): 1.8 IRAY rend info : CUDA device 2 (GeForce GTX 1080 Ti): Allocated 1.65625 GiB of work space (2048k active samples in 0.162s)
- - -
Step 3) loaded alternative textures ( Victoria 8)
2017-07-20 14:05:33.262 Iray INFO - module:category(IRAY:RENDER): 1.0 IRAY rend info : Updating materials.
2017-07-20 14:05:33.265 Iray INFO - module:category(MATCNV:RENDER): 1.0 MATCNV rend info : found 78 textures, 0 lambdas (0 unique)
2017-07-20 14:05:33.271 Iray INFO - module:category(IRAY:RENDER): 1.0 IRAY rend info : Emitter geometry import (1 light source with 2 triangles, 1 instance) took 0.00s
2017-07-20 14:05:33.271 Iray INFO - module:category(IRAY:RENDER): 1.0 IRAY rend info : Updating caustic portals.
2017-07-20 14:05:33.272 Iray INFO - module:category(IRAY:RENDER): 1.0 IRAY rend info : Updating decals.
2017-07-20 14:05:33.274 Iray INFO - module:category(IRAY:RENDER): 1.0 IRAY rend info : Rendering...
2017-07-20 14:05:38.268 Iray VERBOSE - module:category(IRAY:RENDER): 1.9 IRAY rend progr: CUDA device 0 (GeForce GTX 1080 Ti): Processing scene...
2017-07-20 14:05:38.268 Iray VERBOSE - module:category(IRAY:RENDER): 1.8 IRAY rend progr: CUDA device 2 (GeForce GTX 1080 Ti): Processing scene...
2017-07-20 14:05:47.551 Iray VERBOSE - module:category(IRAY:RENDER): 1.3 IRAY rend stat : Texture memory consumption: 1.39478 GiB (device 2)
2017-07-20 14:05:47.552 Iray VERBOSE - module:category(IRAY:RENDER): 1.2 IRAY rend stat : Texture memory consumption: 1.39478 GiB (device 0)
2017-07-20 14:05:47.639 Iray VERBOSE - module:category(IRAY:RENDER): 1.3 IRAY rend stat : Material measurement memory consumption: 0 B (GPU)
2017-07-20 14:05:47.640 Iray VERBOSE - module:category(IRAY:RENDER): 1.3 IRAY rend stat : Materials memory consumption: 75.3086 KiB (GPU)
2017-07-20 14:05:47.640 Iray INFO - module:category(IRAY:RENDER): 1.8 IRAY rend info : CUDA device 2 (GeForce GTX 1080 Ti): Scene processed in 14.366s
2017-07-20 14:05:47.640 Iray INFO - module:category(IRAY:RENDER): 1.9 IRAY rend info : CUDA device 0 (GeForce GTX 1080 Ti): Scene processed in 14.366s
2017-07-20 14:05:47.640 Iray INFO - module:category(IRAY:RENDER): 1.8 IRAY rend info : CUDA device 2 (GeForce GTX 1080 Ti): Allocated 1.65625 GiB of work space (2048k active samples in 0.000s)
2017-07-20 14:05:47.641 Iray INFO - module:category(IRAY:RENDER): 1.9 IRAY rend info : CUDA device 0 (GeForce GTX 1080 Ti): Allocated 1.65625 GiB of work space (2048k active samples in 0.000s)
Step 4) loaded Victoria 8
Removed Genesis 8 Female and loaded Victoria 8 from actor preset
Step 5) loaded alternative textures for Victoria 8
Tried out several different makeup presets
Step 6) loaded Lainey for Victoria 8
Removed Victoria 8 from scene and loaded Lainey for Victoria 8 from actor preset
2017-07-20 14:08:21.570 Iray VERBOSE - module:category(IRAY:RENDER): 1.8 IRAY rend progr: CUDA device 2 (GeForce GTX 1080 Ti): Processing scene...
2017-07-20 14:08:21.571 Iray VERBOSE - module:category(IRAY:RENDER): 1.9 IRAY rend progr: CUDA device 0 (GeForce GTX 1080 Ti): Processing scene...
2017-07-20 14:08:21.571 Iray VERBOSE - module:category(IRAY:RENDER): 1.3 IRAY rend stat : Geometry memory consumption: 15.2232 MiB (device 0), 0 B (host)
2017-07-20 14:08:21.571 Iray VERBOSE - module:category(IRAY:RENDER): 1.2 IRAY rend stat : Geometry memory consumption: 15.2232 MiB (device 2), 0 B (host)
2017-07-20 14:08:26.186 Iray VERBOSE - module:category(IRAY:RENDER): 1.3 IRAY rend stat : Texture memory consumption: 2.87624 GiB (device 0)
2017-07-20 14:08:26.186 Iray INFO - module:category(IRAY:RENDER): 1.3 IRAY rend info : Initializing light hierarchy.
2017-07-20 14:08:26.187 Iray VERBOSE - module:category(IRAY:RENDER): 1.2 IRAY rend stat : Texture memory consumption: 2.87624 GiB (device 2)
2017-07-20 14:08:26.187 Iray INFO - module:category(IRAY:RENDER): 1.3 IRAY rend info : Light hierarchy initialization took 0.00s
2017-07-20 14:08:26.188 Iray VERBOSE - module:category(IRAY:RENDER): 1.2 IRAY rend stat : Lights memory consumption: 948 B (device 2)
2017-07-20 14:08:26.188 Iray VERBOSE - module:category(IRAY:RENDER): 1.3 IRAY rend stat : Lights memory consumption: 948 B (device 0)
2017-07-20 14:08:26.331 Iray VERBOSE - module:category(IRAY:RENDER): 1.2 IRAY rend stat : Material measurement memory consumption: 0 B (GPU)
2017-07-20 14:08:26.331 Iray VERBOSE - module:category(IRAY:RENDER): 1.2 IRAY rend stat : Materials memory consumption: 172.973 KiB (GPU)
2017-07-20 14:08:26.498 Iray INFO - module:category(IRAY:RENDER): 1.8 IRAY rend info : CUDA device 2 (GeForce GTX 1080 Ti): Scene processed in 15.523s
2017-07-20 14:08:26.502 Iray INFO - module:category(IRAY:RENDER): 1.9 IRAY rend info : CUDA device 0 (GeForce GTX 1080 Ti): Scene processed in 15.527s
2017-07-20 14:08:26.503 Iray INFO - module:category(IRAY:RENDER): 1.2 IRAY rend info : CUDA device 2 (GeForce GTX 1080 Ti): Allocated 4.37902 MiB for frame buffer
2017-07-20 14:08:26.503 Iray INFO - module:category(IRAY:RENDER): 1.8 IRAY rend info : CUDA device 2 (GeForce GTX 1080 Ti): Allocated 1.65625 GiB of work space (2048k active samples in 0.000s)
2017-07-20 14:08:26.503 Iray INFO - module:category(IRAY:RENDER): 1.3 IRAY rend info : CUDA device 0 (GeForce GTX 1080 Ti): Allocated 4.37904 MiB for frame buffer
2017-07-20 14:08:26.504 Iray INFO - module:category(IRAY:RENDER): 1.9 IRAY rend info : CUDA device 0 (GeForce GTX 1080 Ti): Allocated 1.65625 GiB of work space (2048k active samples in 0.000s)
Step 7 loaded alternative textures for Lainey
Tried out several different makeup presets
Also raised SubDivision level to 3.

Daz 3D is part of 
Connect
DAZ Productions, Inc.
7533 S Center View Ct #4664
West Jordan, UT 84084
Licensing Agreement | Terms of Service | Privacy Policy | EULA
© 2025 Daz Productions Inc. All Rights Reserved.
Comments
Step 8) 1st set of error messages triggered after swapping out another face makeup texture
That error message appeares only in the log file.
At this point the user is very likely not aware that an error has happened.
-> The error message is only visible in the log file but does not seem to appear in the bottom left info bar.
Step 9) loaded Lainey Hair - 2nd set of error messages
During loading of the Lainey Hair several further error messages happen
The info bar of the Nvidia Iray live preview port in the bottom left corner indicates a switch to CPU mode.
“rend stat: Native CPU code generated”
The data:
DAZ Studio Log file summary
The total VRAM is: 11 GiB
The available VRAM is: 9.17244 GiB
Geometry memory consumption (highest): 65.8009 MiB
Texture memory consumption (highest): 2.87624 GiB
work space allocated (highest): 1.65625 GiB
frame buffer allocated (highest): 4.42539 MiB
- - -
GPU-Z screenshots confirm this data:
At the time of the error messages when the Lainey Hair was loaded only 3'642 MB of the dedicated Memory was used.
- - -
The data strongly suggests that there was plenty of VRAM left.
9 GB - 3.6 GB => around 5 GB still available to use.
There was no reason to drop to CPU mode because of lack of VRAM.
- - -
The error messages
the launch timed out and was terminated (while launching CUDA renderer in core_renderer_wf.cpp:816)
the launch timed out and was terminated (while copying device buffer)
Failed to launch renderer
Error while copying frame buffer requires restart
Failed to merge device frame buffer into master buffer
Device failed while rendering
All available GPUs failed.
Falling back to CPU rendering.
- - -
Commentary:
Customers payed thousands of dollars for the latest Nvidia GPU and then the Nvidia Iray live preview viewport falls back to CPU mode on a regular basis.
This is a critical issue that makes working efficiently with the Nvidia Iray live preview viewport impossible in any work related environment.
It is not an acceptable solution to restart DAZ Studio on a regular basis. To much working time is wasted on the restarting process especially with larger scenes.
I fail to understand how two years after Nvidia Iray for DAZ Studio was released such a basic issue has not been addressed and resolved.
- - -
The questions:
1) Why is this error happening on a regular basis?
-> If you follow the described steps you can trigger this error consistently.
2) Is this an error caused by the DAZ Studio implementation of Iray?
or
3) Is this a general error of Nvidia Iray?
4) Are DAZ3D and Nvidia aware of this issue?
5) Can either DAZ3D or Nvidia give an estimate when they are planning to address and resolve this issue?
- - -
I submitted a summary of this issue and a complete log file in
Request #248297
- - -
@ other DAZ Studio users reading this
REQUEST FOR PARTICIPATION
It may help if you just pay attention to the bottom left info message whenever you work with DAZ Studio anyway.
- Make sure to only load objects and textures that fit well into your available VRAM.
- If you notice that the Nvidia Iray live preview port has switched to CPU mode have a look at your log file and if possible share it:
Help -> Troubleshooting -> View Log File...
- - -
- - -
TEST EXAMPLE 2)
This time I took about 30 minutes of randomly loading objects, swapping textures without using the command File/New and just manualy deleting objects with delete key.
-> No issues.
Then I cleared the scene by using
File / New
-> A dialogue window popped up indicating that the scene is being cleared. While this happend the message window indicated that CPU mode is activated.
I went ahead and loaded a new environment that then was indeed loaded in CPU mode.
In this example as well there was still plenty of VRAM left.
-> The Nvidia Iray live preview viewport falls into CPU mode for another reason.
-> Why is CPU mode activated in the Iray live preview viewport during the process of clearing the scene with File/New?
- - -
Hello, thanks for sharing your experinces and workarounds with this issue. I got a very similiar issue.
I am rendering an image sequence of 90 frames. It goes like this:
I start rendering in iray GPU mode. First frame is rendered in GPU mode without a problem. Takes about 10-11 mins to render.
Then it switches to CPU for the next frame which takes more than a hour to render.
For the next frame it switches back to GPU and renders very fast again. Then switches back to CPU mode for the next frame leaving my GPU at %0 utilization again. I have checked my GPU memory and it still had more than 30% memory avaliable.
At this point i stop the render to try swtiching to GPU mode for the last frame i stopped. After trying to render several times it never switches back to GPU for that frame. So i restart DAZ Studio and try that last frame i stopped again. It renders in GPU mode without a problem but it switches back to CPU mode again for the next frame. It will always keep switching between CPU and GPU modes after each frame.
Btw i tried with and without optix mode and result was the same. Optix does speed up my renders by 20-25% though. But it doesn't affect the GPU to CPU switch issue.
FWIW, I've never encountered this issue, and it sounds like there are a lot of people who also haven't had the problem. So I'm wondering if it might be maybe a driver issue on individual machines or something?
When I render I tend to keep an eye on my CPUID HWMonitor application which shows the % utilization of the CPU cores and the GPU, as well as memory usage, etc. It's a free app. And D|S uses the CPU to load the scene and transfer it to the GPU, and the instant my render window shows the first grainy image my GPU utilization goes to 100%, and CPU drops off.
The only time I had an issue was once when I actually did run out of GPU VRAM (8 GB on my GTX 1070), and that was partly due to the fact that I also have monitors plugged into the card, and Windows was taking like 2GB of the VRAM for it's own use.
edited / updated:
rephrased to keep the tone more general and on topic.
added some additional observations that were shared in the support ticket but not mentioned in this thread.
- - -
@ In general:
The current status of the support ticket is that the information has been passed on to developers.
- - -
@ amylee_07
Thank you for sharing.
I have not made tests with Iray and animations.
Nevertheless I do recall having seen some other forum posts that describe similar issues when rendering animations.
- - -
@ ebergerly
How often do you check the DAZ Studio log file for error messages?
In any case to me it seems you have a different system setup than mine.
I use
one GTX 1080 for the display
two GTX 1080 Ti for rendering
I do update the Nvidia Iray drivers as soon as I notice the message when new ones are released.
Sometimes I wait a few days when I need to finish a project and do not want to risk interruptions.
- - -
Do you always use the Nvidia live preview viewport in every activity?
An activity is a "separate" window of DAZ Studio on which you have different tabs for specific activites. (example: Installation, Scene Setup, Animation, etc)
When you switch between activities the whole Scene needs to be reloaded into VRAM even when the NVidia Iray live preview viewport drawing style is selected in both activities.
-> I have the Nvidia Iray live preview set as the default drawing style at least in two activites. Sometimes it is used in three different activities.
- - -
Do you always leave the Nvidia live preview viewport open when creating scenes in DAZ Studio?
Do you never switch to any other drawing styles while working in DAZ Studio?
-> Sometimes I also do switch to different drawing styles when adjusting high poly count objects.
But I try to keep the live viewport active as much as possible because I enjoy working with an accurate real time viewport.
- - -
Speculation:
My guess is that other users may not use the NVidia Iray live preview viewport always because just one GPU may not be fast enough to work with the Nvidia Iray live preview viewport open with larger scenes.
My guess is that others may use the Nvidia Iray live preview viewport for some workflow steps and then switch to another drawing mode.
With only one GPU the switch to CPU mode may also not be that noticeable because viewport interactivity may be slow in both cases.
- - -
My goal is to provide DAZ3D and Nvidia with information about error messages that happen when the Nvidia Iray live preview port remains active always during workflows.
What exactly does give you this impression?
My impression is:
- There is no dedicated forum section for Iray for DAZ Studio
- There are posts of various users scattered across many different forum areas and threads in which users are confused why Iray switches to CPU mode.
- Some of those reports may be because of lack of VRAM. Other issues such as mine clearly have nothing to do with lack of VRAM.
- There may a limited amount of users who have a computer with a two or three video cards setup that allows to work with the Nvidia Iray live viewport open at all time
- There may not be many experienced users who are aware about the VRAM information in the DAZ Studio log file
- Many users may not even be aware that errors happen
- There may only be few users who bother to come to the forum and share log files when they encounter errors
- - -
What I do know for sure is:
I have been working with OctaneRender for DAZ Studio since 2013.
In OctaneRender I am able to work with the live viewport active all the time.
Since 2013 in OctaneRender for DAZ Studio I was able to click on a button to manually restart the GPU live viewport if it fails to update automatically for one reason or the other.
Nevertheless, since Iray was added to DAZ Studio in 2015 no such "GPU live viewport restart" feature was added to DAZ Studio Iray.
- - -
Two suggestions:
1. Track down and fix whatever issues trigger the Nvidia Iray Live viewport to switch to CPU mode
-> Share information with Nvidia, implement a system to forward error log messages related to Iray automatically to Nvidia
2. Add a button to manually restart the GPU mode of the Nvidia Iray live preview viewport
-> It seems like a brute force approach having to restart the whole DAZ Studio application every time when just the Nvidia Iray viewport switches to CPU mode.
- - -
Just a thought...
What I usually do to bug fix is strip my machine down to the simplest form and then add stuff to see if some hardware is causing problems.
After scanning your error log I saw this:
error: CUDA device 2 (GeForce GTX 1080 Ti): Device failed while rendering
2017-07-20 14:11:44.354 WARNING: dzneuraymgr.cpp(307): Iray WARNING - module:category(IRAY:RENDER): 1.8 IRAY rend warn : All available GPUs failed.
2017-07-20 14:11:44.354 Iray INFO - module:category(IRAY:RENDER): 1.8 IRAY rend info : Falling back to CPU rendering.
2017-07-20 14:11:44.354 WARNING: dzneuraymgr.cpp(307): Iray ERROR - module:category(IRAY:RENDER): 1.8 IRAY rend error: Abort because of fatal device failure
Sounds like it had a problem with the GTX 1080ti? Have you tried removing it and trying again?
Also, could there be some SLI issues?
Also, I'm not understanding your problem. Is it that the render goes to CPU with only the realtime Iray preview, or when you've got the realtime preview running at the same time you are rendering?
edited: rephrased
There is no issue with my machine as far as I can tell. There are no crashes or errors in any other applications that use the GPU.
How likely is it that two GPU are malfunctioning at the same time?
How likely is it that two GPU are malfunctioning at the same time when a third GPU is assigned to the display?
update /edit:
The device failing may not be the cause but the result.
In all error messages the common theme seems to be:
(while de-allocating memory)
Error while copying frame buffer requires restart
Failed to merge device frame buffer into master buffer
It is recommended to switch SLI off when using Iray
I have not installed an SLI bridge because in all other GPU render engines I use it is also recommended to turn SLI off.
This thread was intended for the issue that the Nvidia Iray live preview switches into CPU mode when setting up the scene.
Other posters are bringing up similar issues.
Maybe the cause of those issues are related.
Maybe those are different issues that lead to the same effect -> switch to CPU mode.
I do not know.
- - -
-> Again, the information has been passed on to the developers. Let's see what they can come up with.
If you can share your own error log files please do so.
Wow, sorry just trying to help.
If you want to help then please have a look at your log file on a daily basis and check it for error messages.
update/edit:
I do realize that you have good intentions. -> Thank you for trying to help.
Right, I'll do that just for you.
I was having no issues until a couple of days ago; but I was doing a lot of testing, but not loading and unloading of figures/textures and similar.
Most of what I was doing was adjusting lights; and this caused the preview window to refresh constantly; today was my worst experience. I had to restart to get it to render.
I know it isn't using all available RAM on the gpu.
No intention of buying any more Nvidia cards until this is resolved. I swtiched to Nvidia because AMD weren't getting their act together, and I can very easily switch back. IRAY isn't the only option.
Always look at the first error message, the rest is useless most of the time:
Each update takes a few seconds and suddenly it is silent for 13 seconds, that should indicate that the GPU is no longer responding, the reason for this is not easy to find, can be many things, it can be a bug in DS, a bug in IRAY, a bug in the drivers, a bug that only happen when you have a specific type of GPU, when you have some combination of different GPU's and so on, windows have a watch dog that keep an eye on the video drivers also that can go bonkers on you.
The message All available GPUs failed.
does not mean the card or driver failed, it mean that something failed when it tried to use the card(s), not enough memory, card does not support some feature, card is not repsonding, blablabla, it's a very generic message that say, "sorry something went wrong", if all GPU's fail it can be some hardware error on the bus also that cause it to happen, so it might even be related to the type of motherboard being used or of course overheating, a few degrees overheating over time will cause the GPU to shutdown/throttle down to protect it, this will/may also cause "GPU failed" messages (78 degrees i not very high so no reason to assume that is the problem in your case).
When IRAY connect to a video card it allocates a context, this is used to keep track of allocated memory and other resources used so that they can be released when no longer used, if something stops working and it helps to release this context (restart IRAY) it is a big chance that there is a bug somewhere that does not free used memory correct (can be in DS, IRAY or driver), when the context is released all used memory no matter what is deleted and a new context is created and you would be good to go again.
Another things to be away of is that any memory statistics depending on how it is implemented may depend on the driver/renderer being "without" bugs otherwise it may not show correct statistics.
2017-07-22 02:25:16.424 WARNING: dzneuraymgr.cpp(307): Iray ERROR - module:category(IRAY:RENDER): 1.13 IRAY rend error: CUDA device 0 (GeForce GTX 1080 Ti): Kernel [0] failed after 13.242s
A kernel is a piece of GPU code (CUDA) that failed to execute in this case. From the messages, it looks like there was a memory allocation error though something else may have caused the initial error. Can you check that you didn't have another instance of DAZ Studio still in your task manager that didn't close properly? This will often cause the error you are seeing. Otherwise, not sure.