What's with the high memory usage?
 DarkEmperor13
Posts: 31
DarkEmperor13
Posts: 31
Hey so I'm kinda puzzled on something. I've attached an image and as you can see, when i first start up Daz Studio, my memory sky rockets up to over 2000mb of memory. No objects in scene, just a blank empty scene. my pc has 9gb of ram
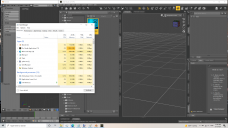
issue.png
1920 x 1080 - 326K
Post edited by DarkEmperor13 on
Daz 3D is part of 
Connect
DAZ Productions, Inc.
7533 S Center View Ct #4664
West Jordan, UT 84084
Licensing Agreement | Terms of Service | Privacy Policy | EULA
© 2025 Daz Productions Inc. All Rights Reserved.
Comments
What does your log say? (Help->Troubleshooting->View Logfile)
On my W7, opening DS 4.15 adds 600MB's of RAM load.
...I'm still using the 4.12 Beta (W7 as well) and it clocks in at 245 MB after startup with nothing loaded in the viewport. and that's split among two displays with several tabs permanently open and no active links to the Daz site (don't use Connect or Central).
Sounds like even on W7 4.15, is a bit of a resource hog.
Check what plugins you have loaded, more so plugins that you have bought.. For me I found that Daz Studio was using over 1.7GB of system memory.. After doing some testing by turning off various bought plugin's, I found one plugin was the culprit and after turning it off I saw Studio's memory usage drop to just over 340MB..
I was amazed that one plugin would cause Studio to gobble up so much system memory.. And I am using Studio 4.15..
Which plugin? I’m wondering if that’s why DS keeps crashing all the time.
Same. I have quite a few plugins and would like to know what plugin you are refering to as well.
To the OP. Your Task Manager shows 11 instances of DS running. Mine just shows one.
For me the product that caused Studio to use a lot of system memory, was the iray-geolocator plugin..
...wondering if that's the number of panes/tabs open plus, as was mentioned, active plugins.
Hmm, just noticed the attachment disappeared
Ghosty12 said:
I can’t find that in the store to see if I own it. Do you have a link?
Could be kyoto but no matter how may panes I have open the TM still shows only one DS instance running. Probably something to do with active plugins as you say. But when I activate and use the Meshgrabber plugin for example it still shows only one instance of DS. I'd like to know why the OPs is showing eleven.
I have seen that in TaskManager before, where multiple processes are displayed for DS. When I clicked to expand the lists, the rests of the proceses were to do with various connections to the CMS service, if I recall correctly, only one process was DS proper.
...ah yes that makes sense. As I'm still on W7 Task Manager always lists out the different processes in a separate line. I just opened Daz and besides the core programme there is a process for the CMS (ContentManagerServer.exe) taking up about 40 MB, and 8 processes titled postgres.exe, each taking up a total of about another 55 MB. This brings the fill total load (with nothing in the viewport) to .331 MB
Same for Chrome, I currently have four tabs open in a single window and TM is showing 17 separate operations. In the attachment (which has returned) there are is an (18) after Microsoft Edge which is probably all the processes the browser is currently running.
It's the difference in how W10 and older versions of Windows display processes in Task Manager.
This is what I get when I open up Studio, it will be either 11 or 1 most of the time it will be 11.. The strange bit although has probably always happened, is the blank Studio icon which is Daz Studio itself..
That blank DS item shows my starter scene for DS which opens when I start DS. I have never seen more than one instance of DS in Task Manager apps.
Here is the link for it https://www.daz3d.com/iray-geolocator still has me wondering why it takes up so much system memory..
....I just use the Sun Dial Set in the Render Preferences folder (Content Library tab) and position it where I need it as I'm not really concerned with setting scenes to actual geographic locations.
Considering this calculates real-time sun positioning for real world planetary locations I can see it being fairly resource intensive.
Just checked my task manager. I also show 11 instances of Daz running, but I only have one copy of the software going. Under Daz, they are listed as PostgreSQL Server. I am not signed into DIM or my account through the software, so I'm not sure what that is about. Each instance is reported to only be using a few MBs though, so I don't think they would seriously drain a system.
That's not high, although after just starting it is actually a little. Studio uses a few hundred once idle with nothing loaded, but...
I've had Studio use many GB more, other 3D applications can also use many GB as can Photoshop.
I've had Studio use close to 50GB when rendering on CPU.
Using a 3090, the card was using 8.4GB, with Studio using 22.8GB at it's peak, with 21.75GB for the duration of the Render; the scene pushed Studio's useage to 12GB when idle.
Oh thanks. Yes, I do have that and have never used it. I guess I’ll try uninstalling it. DS crashes constantly for me and I’m wondering if that’s the culprit.
Ya idk why it shows up having 11 instances. Could it also have something to do with how much content u have?
I have to add my own experiences here: I had a 4.12 installation that worked well and upgraded to a 4.15 and I couldnt re-render old scenes with quite a number of figures on because DAZ overblew my RAM, even after I went from 32GB to 48GB. Usually the RAM usage maxxed out and after some time, DAZ Studio terminated. I did not add some plugins but maybe that geolocator thing is 4.15 by default added.
I dont use a Nvidia Graphics card, and iray is all done on CPU for my case.
So I stayed with 4.12 until now, but I will go for a try now again with the most recent becaue I want to use Genesis 8.1
There are eight threads connected to PostgreSQL Server - these are for the various smart content functions using the CMS (postgres). Windows 7 and 8.1 showed the postgres threads as stand-alone; apparently Windows 10 keeps them associated with the application that spawns them.