dForce error during simulation
I'm having problems initiating dForce simulations in Daz Studio. It was working fine up to 1-2 months ago and have been trying on my own to figure out if any recent updates messed things up. Here are my system details:
Predator Triton Laptop, Core i7 (10th gen) CPU, Nvidia geforce RTX 2070 with Max-Q GPU, Daz Studio 4.15 (Win 64-bit). I have the latest Nvidia driver for my GPU. The automatic updates for windows 10 are current.
My test setup is a primative 4m, 100 division plane over a primative sphere. I've add a dForce dynamic surface modifier to the plane and have added another base plane for the ground. There are currently 4 options for OpenCL Devices listed in the advanced tab of the Simulation panel. Here are the options and what happens when I try to simulate with each:
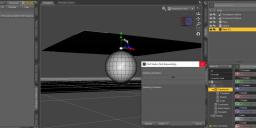
- When I simulate with "Intel(R) OpenCL HD Graphic Intel(R) UHD Graphics", the simulation never starts but instead freezes and I get a message that Daz is not responding. (See attached Image 1) When I try to cancel, DS crashes to desktop.
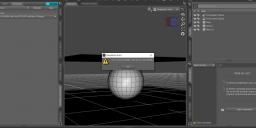
- When I simulate with "OpenCLOn12 Nvidia GeForce RTX 2070 with Max-Q Design", I get "Error during simulation. See log for more details." (See attached Image 2).Of particular concern is the part of the log that reads:
2021-09-14 15:49:45.366 WARNING: ..\..\..\src\dzdynamicsengine.cpp(426): Using device: NVIDIA GeForce RTX 2070 with Max-Q Design
2021-09-14 15:49:55.170 WARNING: ..\..\..\src\dzopenclkernelfactory.cpp(32): Open CL notify: Kernel failed to compile.
2021-09-14 15:49:55.170 WARNING: ..\..\..\src\dzdynamicsengine.cpp(3088): ERROR: Out of Resources (-5)
2021-09-14 15:49:55.252 Total Simulation Time: 9.88 seconds
(see attached log for details)
- When I simulate with "OpenCLOn12 Microsoft Basic Render Driver", I get "Error during simulation. See log for more details." followed by a 'please wait" freeze of my system that requires a task manager end task operation to shut down DS.
- Finally, when I simulate with "OpenCLOn12 Intel(R) UHD Graphics", I get "Error during simulation. See log for more details."
When dForce has worked for me in the past and on other computers, I recall that the advanced panel in the Simulation tab offered only 1 or 2 OpenCL Devices. As detailed above, I now have 4. I'm not very knowledgeable of things like OpenCl so be patient with me if I'm overlooking something that seems obvious here. Your insights would be much appreciated!


Comments
I wonder if they are all failing at the kernel compilation statge, but only the nVidia actually lasts long enough to update the log. I don't know if it's possible to delete any existing kernel files (assuming theya re written to file) in case there is an issue theer that is blocking the recompilation.
hmmm...any idea where I would find these kernel files?
There is something wrong with your drivers or how the GPU's are set up in bios or windows, did you download the Nvidia drivers from; https://www.nvidia.com/Download/index.aspx
2021-09-14 15:44:49.719 WARNING:... Iray [WARNING] - CUDA:RENDER :: 0.0 CUDA rend warn : CUDA module initialization failed.
2021-09-14 15:44:49.719 WARNING:... Iray [WARNING] - CUDA:RENDER :: 0.0 CUDA rend warn : cudaRuntimeGetVersion returned with error 'no CUDA-capable device is detected'
That's what I said, I don't know pf a way to forcve a rebuild and to check if there is a bad build blockling it.
Sorry to necro an old thread, but I'm having a similar issue. Log file says:
2022-11-06 18:17:28.187 [WARNING] :: ..\..\..\src\dzopenclkernelfactory.cpp(32): Open CL notify: Unknown error executing clFlush on NVIDIA GeForce RTX 3090 (Device 0).I did just update my GPU to the latest NVIDIA studio driver. Any suggestions?
Unupdate your driver - the 517 version seems to work. nVidia is aware of an OpenCL issue, but hasn't yet fixed it.
That fixed it. Disappointed that I had to find out the hard way and after losing hours of time troubleshooting. Thanks.
I was in a similar situation and i updated my geforce today. it seems the latest driver works fine! ;-)